Here are some tips and a small guide on how to use MAME for debugging more effectively
I've been working on a ROM hack for the Neo Geo game Puzzle Bobble (video on it here, github repo here). The purpose of the hack is to replace the joystick controls with a rotary dial. The MAME debugger and its Lua scripting have been absolutely indispensable. Using these tools at first was overwhelming and kind of frustrating. But after I got the feel for them they made figuring out how the game works surprisingly easy. Here are some tips to help if you are overwhelmed too.
Games usually run at 60 frames per second and do a massive amount of stuff very rapidly. At first they're pretty much a complete brickwall; so much is going on, so many things are changing, and either waaaaaay too fast if you let the game run on its own, or waaaaaaay too slowly if you step through it line by line. Trying to learn anything at all about them is very hard. This is where MAME comes in. The debugger and its Lua scripting offer tactics you can use to spot patterns, find interesting and relevant changes, and test theories. Frankly before tools like this existed I have no idea how people made ROM hacks. Those people were superstars. Anyway, let's start with the debugger.
The Debugger
The debugger is the real star of the show. To get access to it, add -debug to your MAME command line invocation. I don't believe the debugger can be accessed from the UI. mame samsho1 -debug for example.
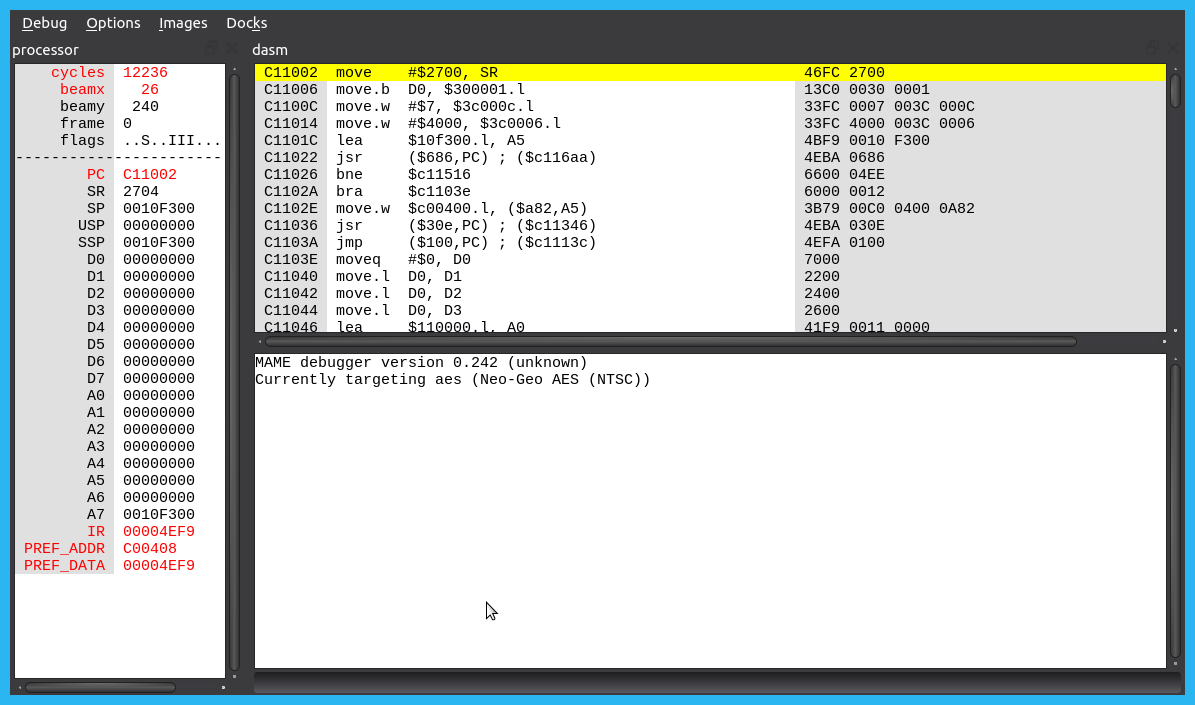
When it first opens, you will see something like this
It starts with the game paused. To start the game type in go or press F5. To make the game pause again, type in step or press F11. Once paused, you can step through the code with...
- F11 - step into: mostly just moves to the next line of execution
- F10 - step over: if the next line to execute is going to jump to subroutine, this lets you skip past it
- shift+F11 - step out: if you are inside a subroutine, this lets you get back out to wherever it was called
The left panel is the registers in the processor. The Neo Geo uses a Motorola 68k, and its registers like D0 through D7 (general purpose registers) and A0 through A7 (address registers) are shown. PC is the program counter, this is an address into the game's ROM that the processor is currently focused on. I don't use any of the other stuff in this pane.
The dasm window to the right shows where the program counter is currently at (in other words, what the game is currently executing). In the case of the Neo Geo, the BIOS is first to do anything, so here MAME is paused at C11002, the first instruction the BIOS will execute. This is because I just launched the game and have not given it a chance to run yet.
Down below is the general output window. This is where logging and results from computations show up.
The DASM Window
Invoking Debug > New DASM Window or pressing CTRL-D will open the disassembly window. MAME can fully disassemble the machine code back to assembly. At least it can for the Motorola 68k and the Zilog Z80 (the two processors in the Neo Geo).
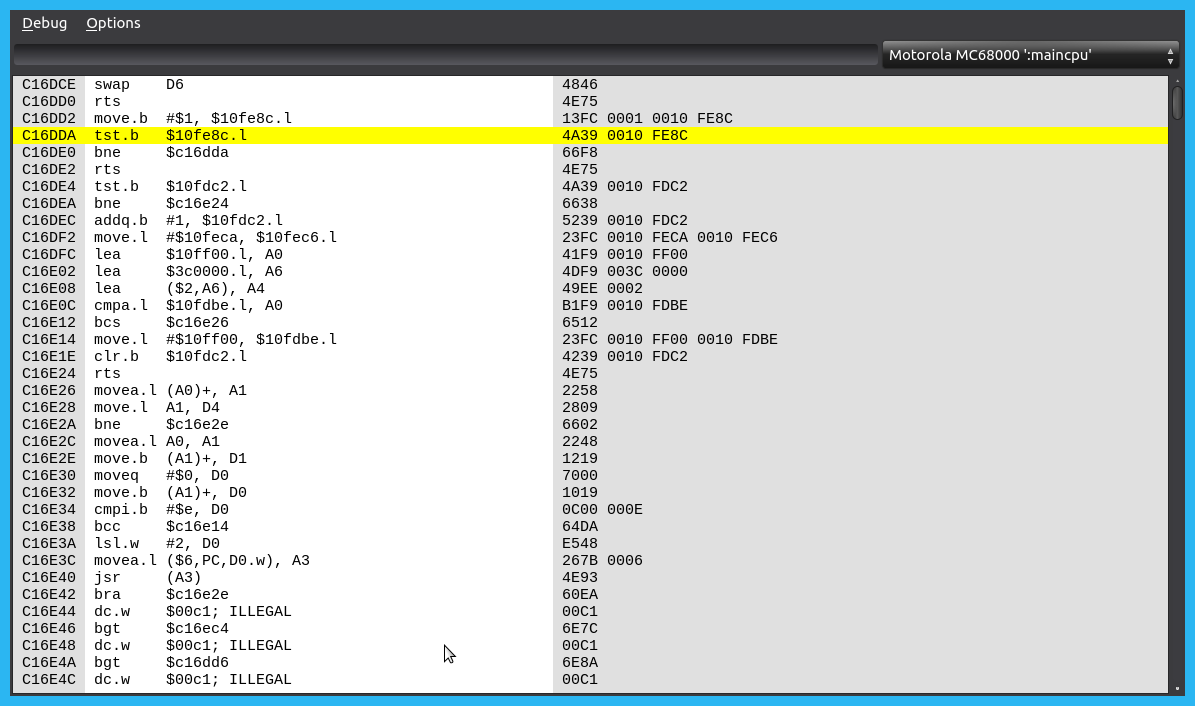
The yellow highlighted line is currently where the program counter is and matches the DASM pane in the main debugger window. The real benefit to this window is being able to jump anywhere you want by entering an address.

Here I haved entered 2f602 as the address. This routine is one of Puzzle Bobble's main routines it runs during gameplay. I look at the disassembly in this window often. After I have applied one of my hack patches, I often come into here and confirm it got applied as I expected.
The Memory Window
Debug > New Memory Window or CTRL-M will open the memory window. This is the current RAM contents of the game. Things in here will change often as the game is running. You can start the game and just watch the changes as they happen. Sometimes just finding an active region of RAM is a first clue into something you want to dig into more.
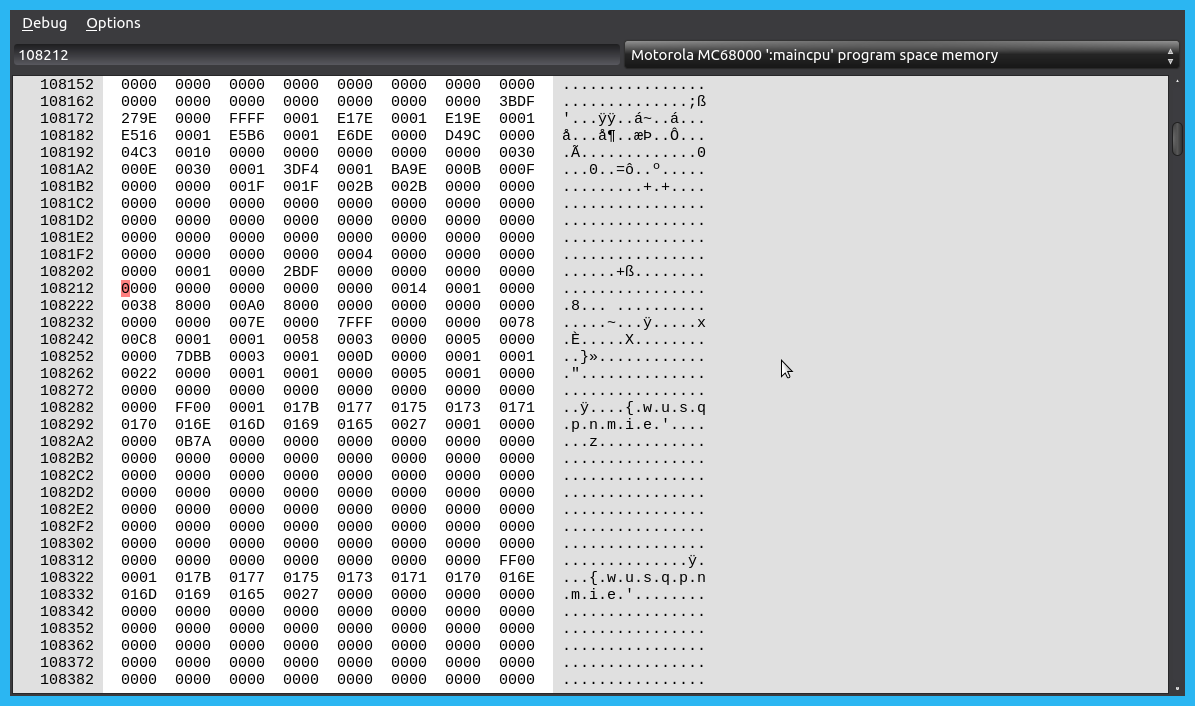
For example here I am looking at memory around 108212 while Puzzle Bobble's main gameplay is happening. These chunks of memory are what the main gameplay routines use. For example, 108262 is currently 22 (in hex, 34 in decimal). That is the shooter's current angle in the game

The Cheat debugger
The cheat debugger is very useful, and often your first stop to understand something about a game. It was made to allow the creation of cheats like "infinite lives" or "invincibility", and cheats are almost always just manipulating the game's running memory to pull off the effect.
My ROM hack changes the controls from using the joystick to using a rotary dial. So to get started, I wanted to know where the game stores the shooter's angle.

I used the cheat debugger to figure this out. First, initialize it. With the game at the main game play mode and paused in the debugger
cheatinit ub This tells the cheat system to keep track of unsigned bytes in memory. Then I enter go, and press on the joystick once to move the shooter as little as possible.
stepcheatnext Since I pressed right, the shooter's angle probably increased by 1 or maybe 2 in memory. This command has the cheat system look at memory and find any bytes that increased. First run step to pause the game. Then cheatnext + to have MAME find the memory changes, and then cheatlist to show all the changes it found
114 cheats found Address=100C9D OK, 114 changes is a lot. From here I unpause the game, press right as lightly as possible, step to pause it, then cheatnext +. I do this a few times, and each time it finds fewer and fewer memory changes. That is good. The last time I got this
9 cheats found >cheatlistAddress=101087 Start is what the value at that address was when you first started the cheat system, way back with cheatinit ub. When I look through the changes, one in particular seems suspicious, 108263 because
- It has a small value, which I would expect as the angle of the shooter is small
- It only increased each time, and only by a little bit, which matches with how I pressed right on the joystick
- It is present in all
cheatlists. I would expect this, because I pressed right every time
So I set the memory window to 108263 and then play the game and make the shooter go left and right, and sure enough, it goes up and down in exact step with my inputs. We have found the right memory location!
Actually the correct memory location is 108262, because Puzzle Bobble stores the shooter angle as a word, not a byte. Not sure why, but it does.
All breakthroughs I have made in understanding the game first started with the cheat debugger.
Watchpoints
Watchpoints let you break into the debugger whenever memory is written to or read from. By itself this is rarely useful, because games interact with RAM very quickly.
A simple watchpoint would be wpset 108262,1,w. This will break into the debugger whenever Puzzle Bobble updates the shooter's angle. This is a great next step, because I want to start zeroing on the part of the code that is making shooter angle changes.
Watchpoints are more powerful and interesting when you add in conditions and actions. For example, wpset 108262,1,w,b@10fd96 != 0 This says "break into the debugger whenever 108262 is written to, and the byte at 10fd96 is not zero". 10fd96 on the Neo Geo is BIOS_P1CURRENT, a byte storing the current state of the joystick. If it's not zero, that means some kind of input has been received. Now when you run the game, it will only break back into the debugger when you first press right on the joystick.
Watchpoints can have conditionals as their 4th argument, like b@10fd96 != 0 above. They can also have actions as their 5th argument, such as { printf "value written: %x",wpdata }, which will print the written value to the output window.
Some useful watchpoints
wpset printf "108262 set with: %x" ,wpdata; g }That double comma is not a typo, this watchpoint has no condition, so it is left blank.
whenever the shooter angle changes, write the value to the console and don't stop the debugger. You can separate actions with ;, much like writing a program. g means "go", ie don't break just let the game keep playing. printf works very similar to C's printf.
wpset 3c000c ,1,w,wpdata printf "vblank ack" ; g }wpset printf "108212 set with: %x at %x" ,wpdata,PC; g }wpset printf "108212 read at: %x" ,PC; g }Here I am setting up three watchpoints. All three print to the screen and let the game keep going. 3c000c is the register the game writes to when acknowledging the vblank interrupt (ie, the system is now starting to draw the next frame). The other two are listening to reads and writes at 108212 and outputting where the writes came from (PC being the program counter).
This produces output like this
vblank ack 108212 read at : 2E9BA 108212 at 2E9BA 108212 read at : 2F5C4 108212 read at : 2F606 108212 read at : 2F746 vblank ack 108212 read at : 2E9BA 108212 at 2E9BA 108212 read at : 2F5C4 108212 read at : 2F606 108212 read at : 2F746 vblank ack 108212 read at : 2E9BA 108212 at 2E9BA 108212 read at : 2F5C4 108212 read at : 2F606 108212 read at : 2F746 ...This is very useful information! "vblank ack" is just telling me a frame just started, so I know the next lines that follow are happening sequentially. Without the "vblank ack", the other 5 lines would just be repeated over and over and I wouldn't really be able to tell which happened first within a frame.
This tells me that 2E9BA is updating 108212 (this value is how far the shooter should move based on input. So if the player pressed right, this will be 1 to indicate the shooter should move one degree to the right). And then the other locations are reading in that value and doing things accordingly (like actually moving the shooter, changing animations, etc).
My ROM hack is about changing the input from using a joystick to a rotary dial. So I knew once 2E9BA sets the shooter delta, I could safely inject my own code that would re-set the shooter delta based on what the rotary dial is doing, as long as I injected it before 2F5C4 and the rest read the value. I successfuly did that, and now my ROM hack allows the shooter to change using rotary controls, and the game really has no idea, everything else "just works" because this output told me no one else anywhere is changing this value. Having your hack "play along" with the rest of the game as much as possible is good, as you will get less bugs that way.
Breakpoints
Breakpoints are similar to watchpoints except they just stop whenever the program counter hits them. bpset 2f602 will cause the game to break into the debugger whenever the game's CPU executes the instruction at 2f602 in the ROM.
Like watchpoints, they can have conditions and actions.
bpset 2f602 , b@10fd06 != Like above, this will only break when BIOS_P1CURRENT (which is 10fd06) is not zero. So only breaks when some input has happened like pressing on the joystick (this trick is Neo Geo specific btw).
bpset 2f602 ,,{ printf "shooter delta is: %d" ,b@108212; g }Whenever the game hits 2f602, print out the current value of 108212 to the screen and let the game keep going.
History
history outputs the path the CPU took to get to where it's currently at. This is extremely useful. I mostly use it to find subroutines. For example here is a typical history listing
(many many lines left out )...02F5EA: move .w rts 02F5BA: rts 02EA4A: bsr $2f602 02F602: move .w beq $2f63e 0f2608: subq .w # 1, bgt $2f63e Here I am currently paused at 2F60C, but what is going on? Where am I? The history helps. We can follow it back and find that at 2EA4A it did bsr $2f602. bsr is "branch to subroutine", and one way a subroutine can get called. And if you look in the history the PC went from 2EA4A to 2F602, showing the jump into the subroutine. This is very useful because it is showing where a subroutine starts. Usually subroutines do one thing, or if they do more than one thing, they are usually related to each other (usually...) So finding the start of a subroutine and just focusing on that one routine and figuring out what it does is a big step foward in understanding the game. One subroutine at a time...
Now that I know the subroutine starts at 2f602, I can set a breakpoint there, and then step through the entire routine and begin to pick apart what it is doing. Or I can do dasm subroutine.txt,2f602,<length> and save the subroutine into a file, then pick apart what it is doing offline. Here is my picking apart of the subroutine at 2f602. Spoiler alert, its job is to take the delta value stored at 108212, usually -1, 0, or 1, and add that to the shooter angle (ie, go from say 24 to 25, shooterAngle = shooterAngle + delta) to cause the shooter to move in response to input.
Other stuff
The MAME debugger has a lot of features. I use the above four the most. Here are some other things it can do
trackmem: kind of like a global watchpoint. It keeps track of all memory writes throughout the whole game, but it holds onto the most recent one, so I have found its usefulness not as good as watchpoints.find: Searches memory for valueswpenable/wpdisable/bpenable/bpdisable: Turns on/off all watchpoints/breakpoints
There are many more. I recommend reading the docs.
Lua Scripts
MAME fairly recently added Lua scripting. This is an awesome and very powerful feature.
To use a Lua script, write it, then launch MAME with mame <game> -autoboot_script <path to your script>
Lua scripts can also be used to create plugins, but we won't get into those here.
Here is a very simple Lua script for Puzzle Bobble that will cause the shooter to move 4 times faster than normal
cpu manager .machine.devices[":maincpu"]mem cpu .spaces["program"]
-- this address is the "shooter delta", whatever gets -- set here will get added to the shooter's current angle address data ) if offset == address then -- by multiplying the value, the end result is the shooter travels -- much faster return data * endend
mem_handler mem :install_write_tap(address, address + on_memory_write )
Then run it with mame pbobblen -autoboot_script fasterShooter.lua
Now when pressing left or right, the shooter moves at 4 times its normal speed. Too fast to be useful of course, but this is just a simple demo.
I use Lua scripts to help test theories I have devised. For example, once I figured out the shooter angle is at memory address 108262, I made this tiny script to help confirm that
cpu manager .machine.devices[":maincpu"]mem cpu .spaces["program"]
-- the shooter angle address address data ) if offset == address then -- force the shooter to always be at 10 degrees return endend
mem_handler mem :install_write_tap(address, address + on_memory_write )Now running Puzzle Bobble with this script, the shooter is locked at 10 degrees and won't budge. The write tap is intercepting the memory write and forcing the write to have a different value. So despite the game's efforts, the shooter angle will always be 10 when this script is active. So without a doubt, 108262 is where the shooter angle is stored.
Again a simple example, but I have written complex Lua scripts that have really helped me figure out something about the game, reproduce a bug, or just explore the game. Early on in my exploration I noticed the game uses about 100 bytes or so, and a lot of those bytes I had no idea what they did. So I wrote a script that would one at a time, prevent writes to each byte. Then when I ran the game, sometimes it was obvious what the byte was for. I also wrote scripts to help confirm my ROM hack is working as I expected.
There is install_write_tap to get involved whenever the game writes to memory, and install_read_tap to get involved whenever it reads from memory. There is also much, much more. The Lua docs cover it all.
I have started a repo collecting Neo Geo Lua scripts here. For example here is one that shows what sprites are currently being used and where they are on the screen
Conclusion
With the debugger and Lua in hand, I am shocked how easy it is to figure a Neo Geo game out. There aren't many Neo Geo ROM hacks, so hopefully these tools will mean more in the future. Thanks to the MAME team for such useful tools.
Cheat Sheet
These are just the commands I use most often. The debugger can do much more
| Debugger - basic commands | |
| go (F5) | Runs/unpauses the game |
| (s)tep (F11) | Pauses the game, breaks into the debugger, executes a single instruction |
| (o)ver (F10) | Steps over a subroutine and keeps debugging from where it returns to |
| out (shift+F11) | Leaves the current subroutine and breaks at its exit point |
| history | Prins out the path the CPU took to get to the current stopped point |
| dasm file.txt,12345,120 | Takes the program rom, starting at address 12345, and disassembles the instructions ending 120 bytes away. Writes the disassembly into file.txt |
| Cheat Debugger - find memory changes | |
| cheatinit <data type> | The cheat system starts tracking memory. Data type can be "ub", unsigned byte, "sb", signed byte, "uw", unsigned word, "ud", unsigned double word, etc |
| cheatnext + | Causes the cheat system to look for increment (+) or decrement (-) memory changes since cheatinit. Can also add on a value to choose what the increment value is, like cheatnext +,1 |
| cheatlist | Lists out the current memory address that are a match |
| Watch points - get notified on memory reads and writes | |
| (wp)set 123456,1,w | Breaks when the game writes a byte to address 123456, the "1" is the data size, 1 for byte, 2 for word, etc |
| (wp)set 123456,1,r | Breaks when the game reads a byte from address 123456 |
| wpset 123456,1,w,wpdata == 3F | Breaks when the game writes a byte to address 123456 but only if the value being written is 3F |
| wpset 123456,1,r,b@456789 == 3F | Breaks when the game reads from address 123456 but only if the byte at 456789 is 3F |
| wpset 123456,1,w,,{ printf "wrote :%x",wpdata; g } | Whenever the game writes to 123456, prints out what the data was, but doesn't stop the game |
| Break points - break into the debugger and pause the game | |
| (bp)set 1234 | Breaks whenever the CPU executes address 1234 |
| bpset 1234,D1 == 5 | Breaks at 1234 if the D1 register's value is 5 |
| bpset 1234,,{ printf "123456 is %x",b@123456; g } | Whenever the CPU hits 1234, prints out what the value of 123456 is in memory, and keeps the game running |
| bpset 1234,D1 == 5B80 && w@A0 == 8A50 | Breaks at 1234 whenever the D1 register is 4B80 and the word that the address register, A0, is pointing to out in memory is 8A50 |